> ## Documentation Index
> Fetch the complete documentation index at: https://docs.coval.ai/llms.txt
> Use this file to discover all available pages before exploring further.
# Dashboards
> Build dashboards to track agent metrics over time across simulations and live conversations.
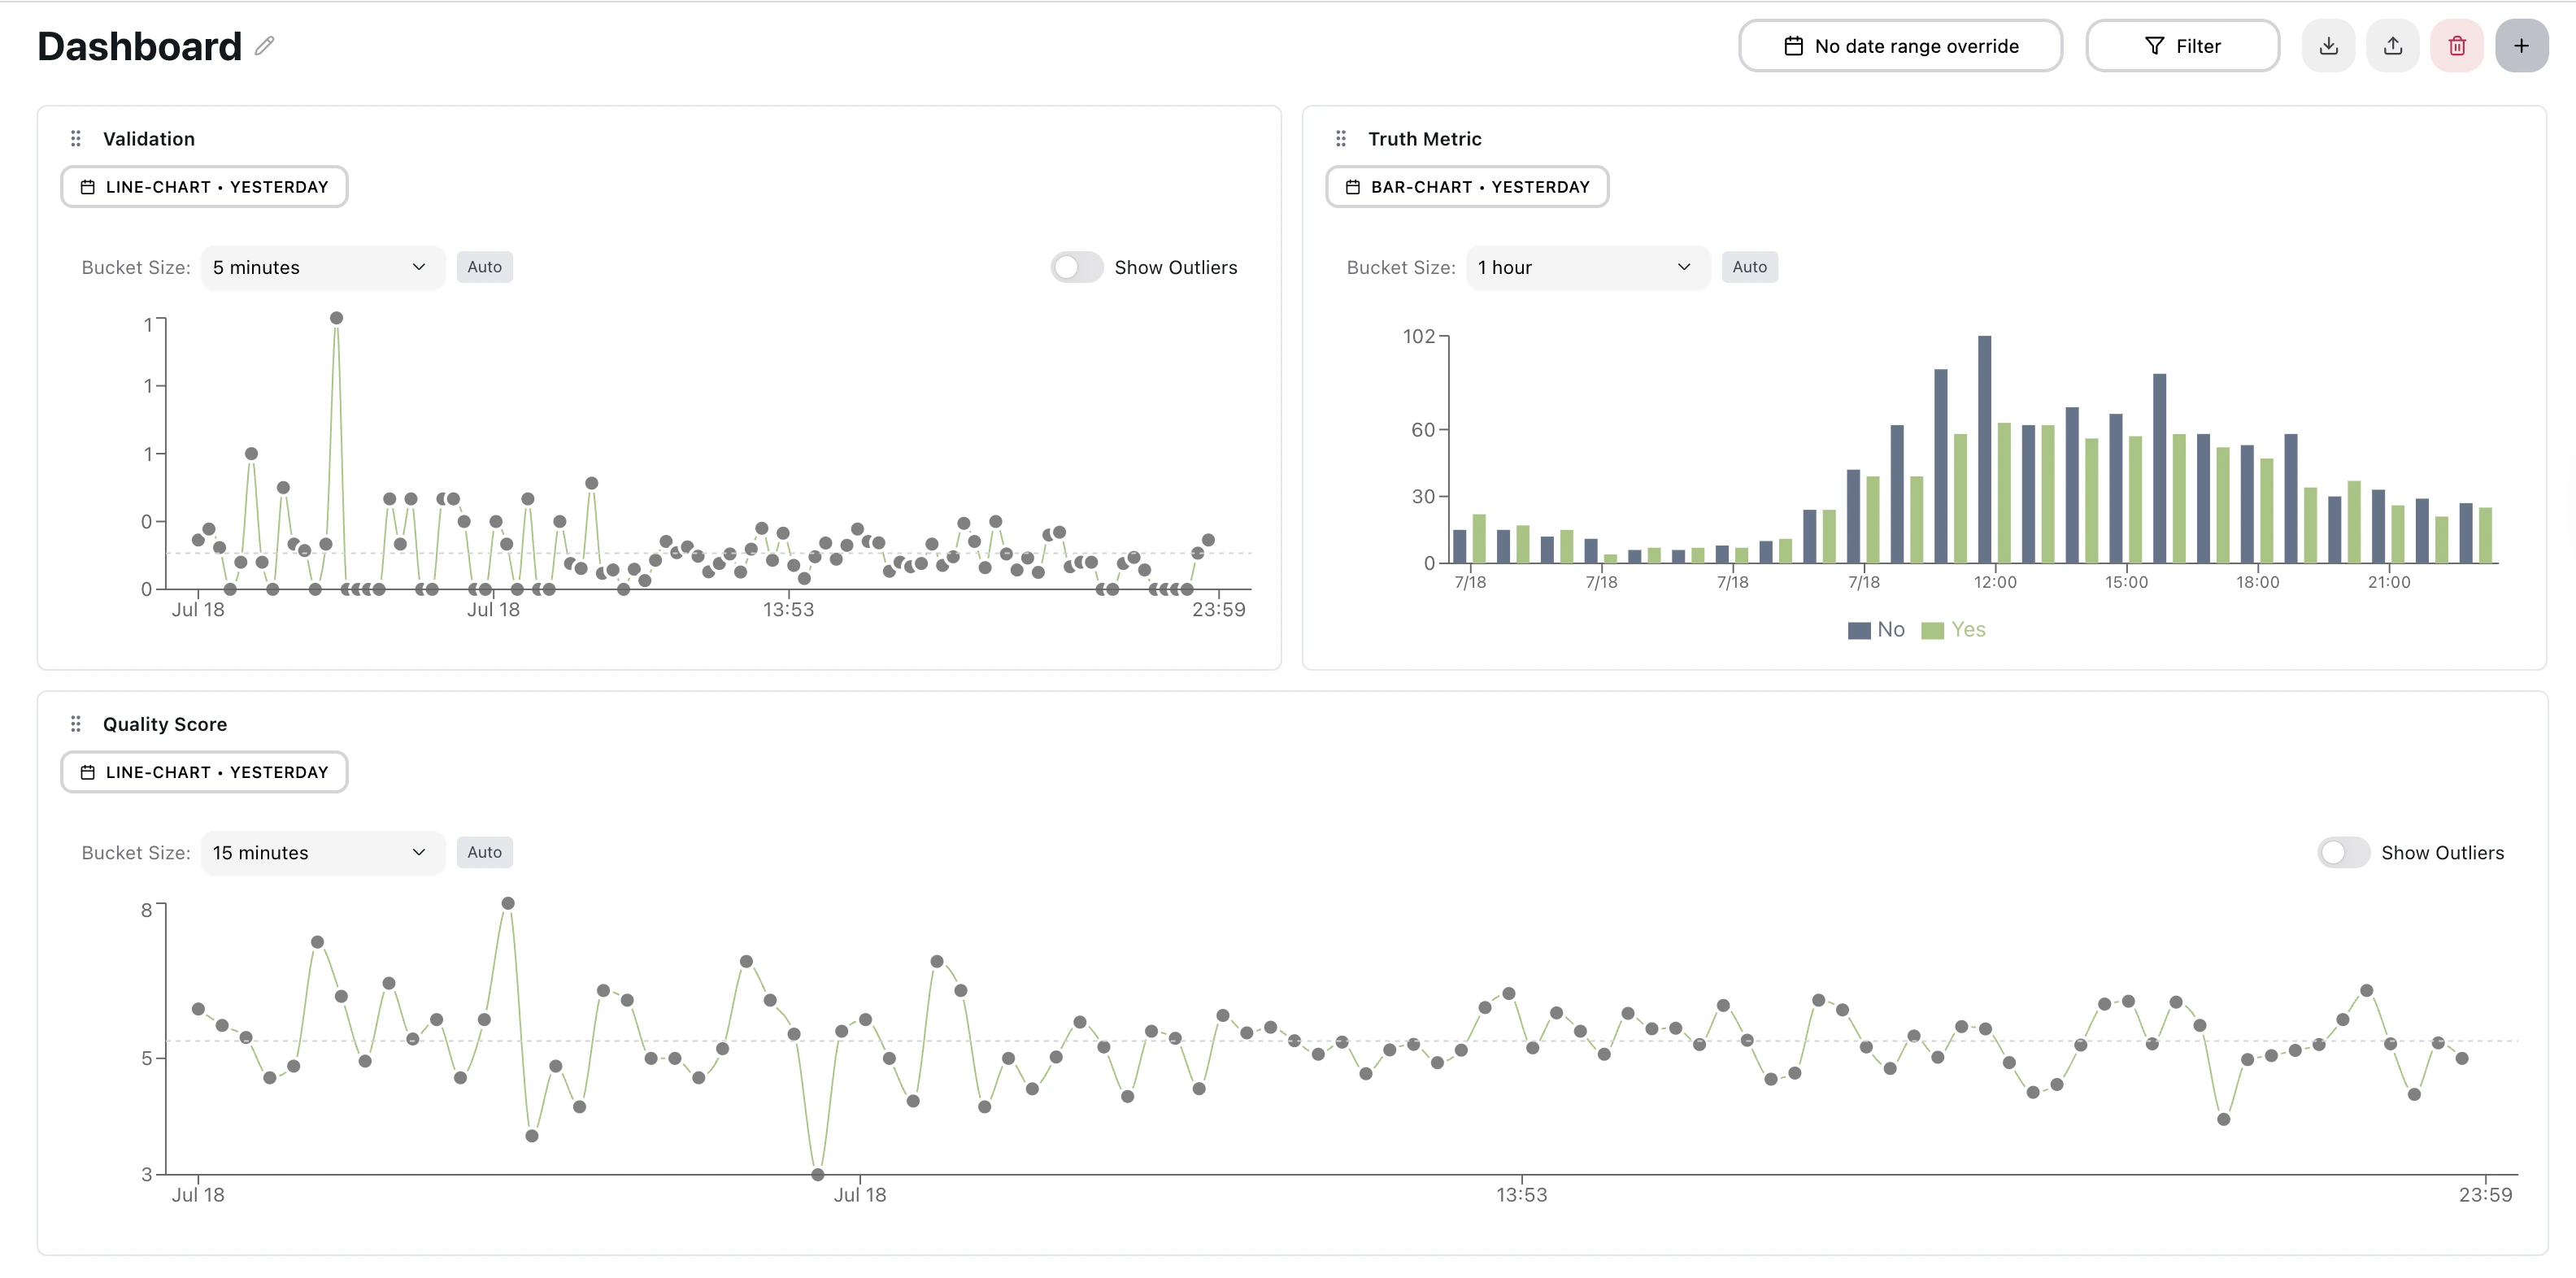
Dashboards chart your metric results over time and let you drill into the calls behind any number. They draw on the same metrics you run on [simulations](/concepts/simulations/overview) and [live conversations](/concepts/conversations/overview), so you can watch performance, catch regressions, and investigate outliers in one place — for voice and chat agents alike.
 ## Building a dashboard
1. Open **Dashboards** from the sidebar. You can keep several dashboards and switch between them.
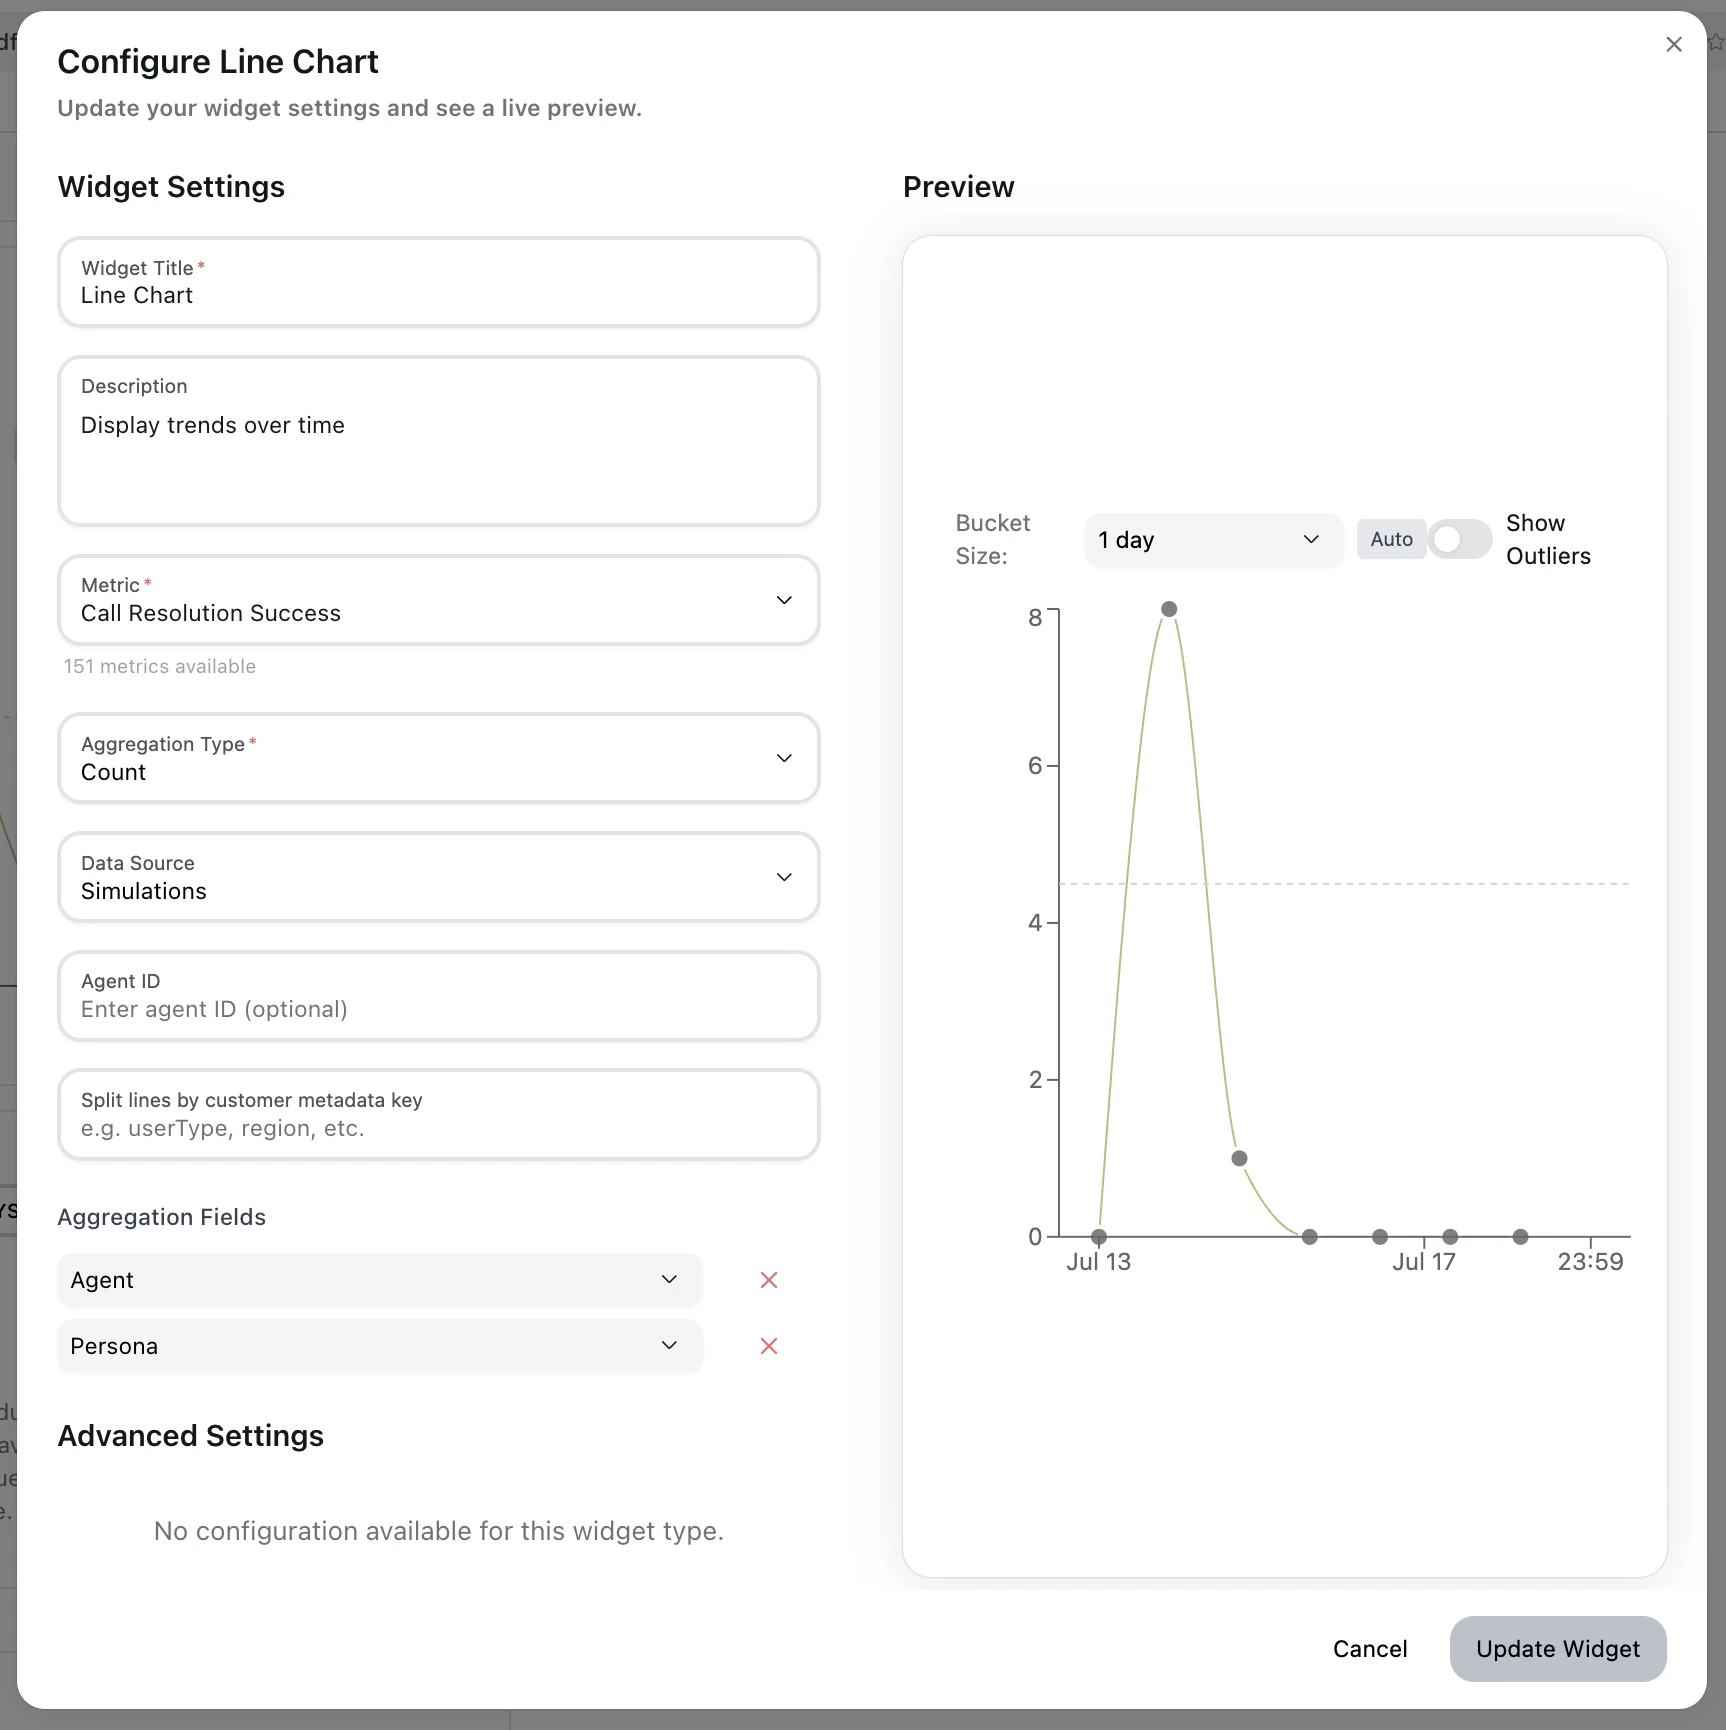
2. Add a widget and choose the metric it should display.
3. Pick a chart type, plus any aggregation or split dimensions (for example, by agent or persona).
4. Apply filters and a date range to scope the data.
5. Arrange widgets on the grid — they resize and save automatically.
Changes preview live as you configure a widget.
## Building a dashboard
1. Open **Dashboards** from the sidebar. You can keep several dashboards and switch between them.
2. Add a widget and choose the metric it should display.
3. Pick a chart type, plus any aggregation or split dimensions (for example, by agent or persona).
4. Apply filters and a date range to scope the data.
5. Arrange widgets on the grid — they resize and save automatically.
Changes preview live as you configure a widget.
 ## Widget types
| Category | Widget | What it shows |
| --------------------------------- | ----------------------- | ----------------------------------------------------------------------------- |
| **Trends over time** | Line | A metric over time, with multiple series and outlier detection |
| | Area | Cumulative trends over time; optionally normalized to % of total |
| **Comparisons** | Bar | A metric across categories (regular or stacked); auto-colors yes/no metrics |
| | Top list | The top 10 values ranked by score, with click-through to the runs |
| | Pie / donut | A proportional breakdown; click a slice to drill in |
| **Single values & distributions** | Statistic | One aggregated number — avg, sum, count, min, max — with an optional box plot |
| | Histogram | How numeric values spread across buckets; click a bin to drill in |
| **Tables & notes** | Table | Sortable raw values, one row per bucket or group; exportable to CSV |
| | Text | Static notes or headers; no data source |
| **Targets & monitoring** | Threshold / target zone | Your metric's threshold drawn on a bar or line chart |
| | Question monitoring | Unanswered questions and conversation gaps |
| | Human review | Review assignees and progress across projects |
A few widgets have extra options worth knowing: **Area** supports drag-to-zoom and custom axis labels, **Statistic** can render one card per agent/persona/template in grouped mode, and **Threshold** shades a fail zone on line charts or a dashed reference line on bar charts.
## Filtering and analysis
### Aggregation
Aggregate by agent, persona, or a combination of the two to compare performance across them. Binary metrics get automatic yes/no breakdowns. You can also filter a widget to specific agent IDs.
### Date ranges
Set a date range per widget, or apply one across all widgets at once. Presets include Today, Yesterday, Last 7/30/90 days, and Year-to-date, plus custom "Last N days/weeks/months" or specific date periods. Time buckets (hours, days, weeks, months) are chosen automatically based on data density and are calendar- and timezone-aware.
### Metadata filters
Filter dashboard data by custom metadata attached to your simulations or live calls — customer tier, campaign ID, region, experiment variant, and so on.
Metadata filters work with any key-value pairs you've included in your
simulation or conversation data. Values are matched exactly, and multiple
filters are combined with AND logic.
Choose from existing metadata keys or enter a custom key, select from suggested values or type your own, and stack multiple filters to narrow the analysis. Filter combinations can be saved and reused.
### Test case filters
Filter to specific test cases to isolate performance on a subset of scenarios. Combine with agent, persona, and metadata filters for precise segmentation — useful for regression tracking on a fixed set of canonical inputs.
## Drilling in
### Focus mode
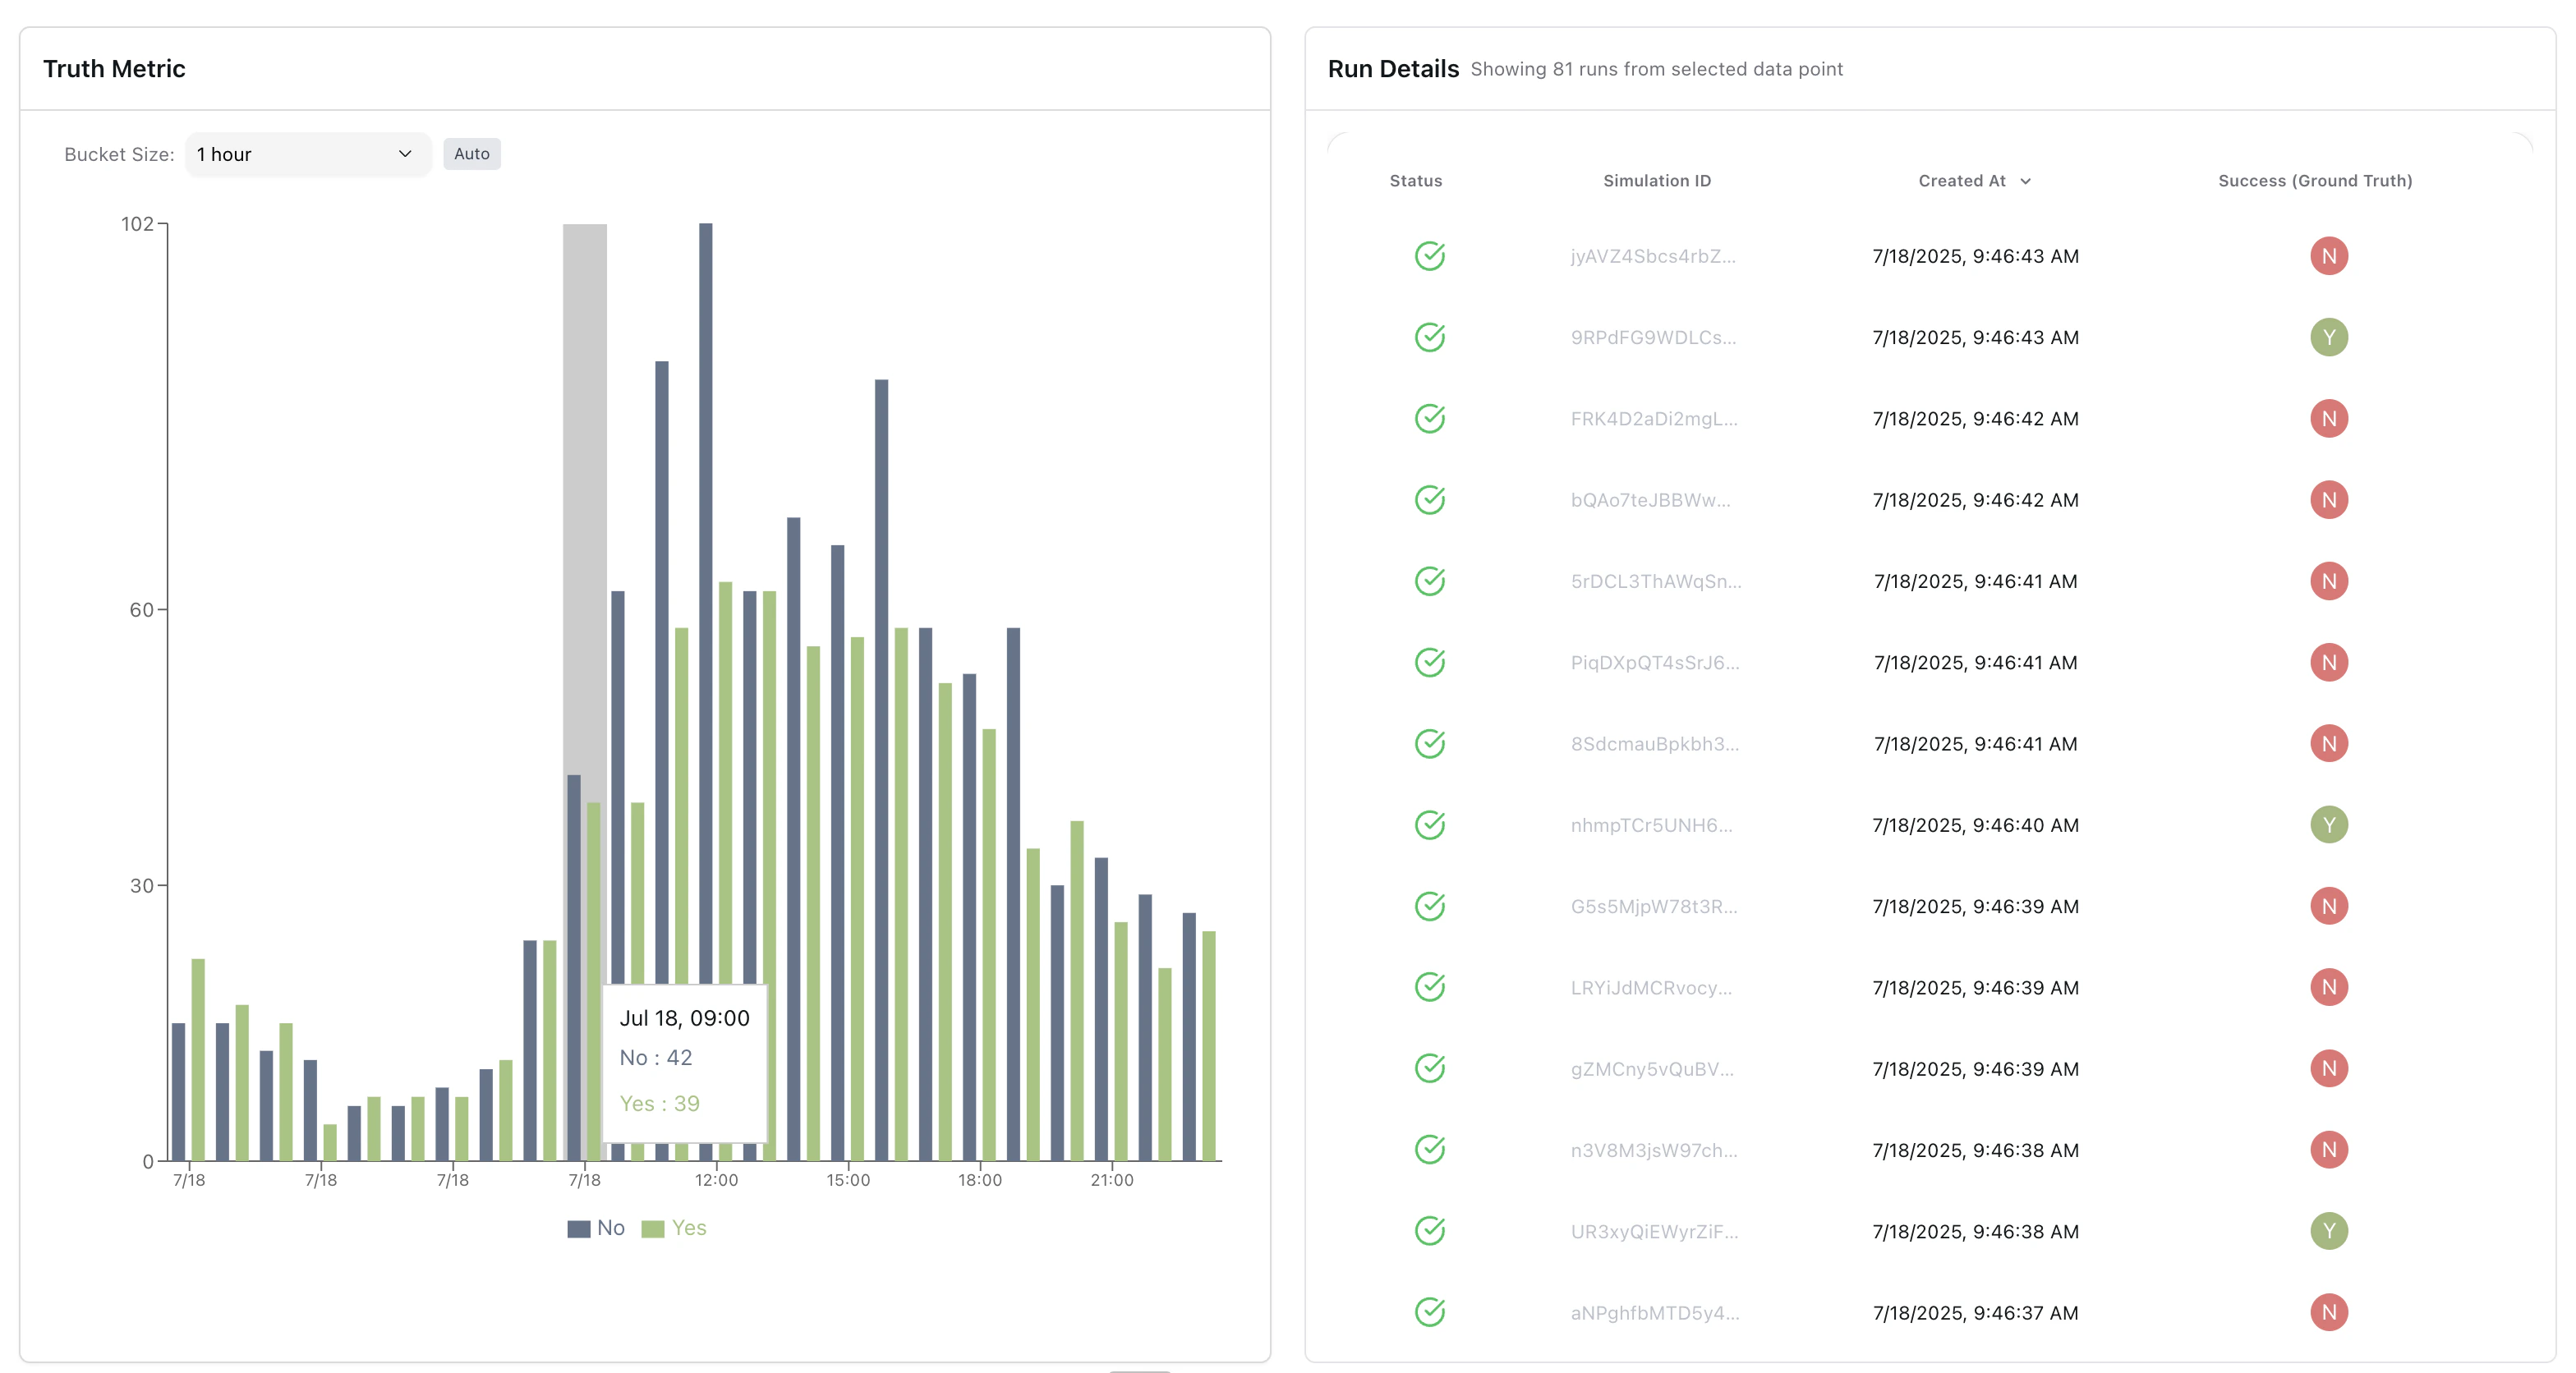
Click any data point for a full-screen view: the chart on the left, the detailed run data on the right.
### Run details
Drill from an aggregate chart down to the individual calls behind a data point. See exactly which calls contributed to each number and investigate outliers at the source.
## Widget types
| Category | Widget | What it shows |
| --------------------------------- | ----------------------- | ----------------------------------------------------------------------------- |
| **Trends over time** | Line | A metric over time, with multiple series and outlier detection |
| | Area | Cumulative trends over time; optionally normalized to % of total |
| **Comparisons** | Bar | A metric across categories (regular or stacked); auto-colors yes/no metrics |
| | Top list | The top 10 values ranked by score, with click-through to the runs |
| | Pie / donut | A proportional breakdown; click a slice to drill in |
| **Single values & distributions** | Statistic | One aggregated number — avg, sum, count, min, max — with an optional box plot |
| | Histogram | How numeric values spread across buckets; click a bin to drill in |
| **Tables & notes** | Table | Sortable raw values, one row per bucket or group; exportable to CSV |
| | Text | Static notes or headers; no data source |
| **Targets & monitoring** | Threshold / target zone | Your metric's threshold drawn on a bar or line chart |
| | Question monitoring | Unanswered questions and conversation gaps |
| | Human review | Review assignees and progress across projects |
A few widgets have extra options worth knowing: **Area** supports drag-to-zoom and custom axis labels, **Statistic** can render one card per agent/persona/template in grouped mode, and **Threshold** shades a fail zone on line charts or a dashed reference line on bar charts.
## Filtering and analysis
### Aggregation
Aggregate by agent, persona, or a combination of the two to compare performance across them. Binary metrics get automatic yes/no breakdowns. You can also filter a widget to specific agent IDs.
### Date ranges
Set a date range per widget, or apply one across all widgets at once. Presets include Today, Yesterday, Last 7/30/90 days, and Year-to-date, plus custom "Last N days/weeks/months" or specific date periods. Time buckets (hours, days, weeks, months) are chosen automatically based on data density and are calendar- and timezone-aware.
### Metadata filters
Filter dashboard data by custom metadata attached to your simulations or live calls — customer tier, campaign ID, region, experiment variant, and so on.
Metadata filters work with any key-value pairs you've included in your
simulation or conversation data. Values are matched exactly, and multiple
filters are combined with AND logic.
Choose from existing metadata keys or enter a custom key, select from suggested values or type your own, and stack multiple filters to narrow the analysis. Filter combinations can be saved and reused.
### Test case filters
Filter to specific test cases to isolate performance on a subset of scenarios. Combine with agent, persona, and metadata filters for precise segmentation — useful for regression tracking on a fixed set of canonical inputs.
## Drilling in
### Focus mode
Click any data point for a full-screen view: the chart on the left, the detailed run data on the right.
### Run details
Drill from an aggregate chart down to the individual calls behind a data point. See exactly which calls contributed to each number and investigate outliers at the source.
 ### CSV export
Export drill-down data from the run details panel.
* **Internal links** are accessible to logged-in team members.
* **Shareable links** make the linked simulations public so you can share them externally.
* Exports all visible columns, including metric values, timestamps, and run metadata.
## Alerts from a widget
Create a monitor straight from any metric widget, without leaving the dashboard. Click the bell icon and set:
* **Monitor name** — a label for the alert.
* **Threshold** — the value that triggers it (GT, GTE, LT, LTE, or EQ).
* **Run types** — apply it to simulation runs, monitoring runs, or both.
This is a shortcut to the Monitors page with the widget's metric pre-filled, so you only set the threshold condition.
### CSV export
Export drill-down data from the run details panel.
* **Internal links** are accessible to logged-in team members.
* **Shareable links** make the linked simulations public so you can share them externally.
* Exports all visible columns, including metric values, timestamps, and run metadata.
## Alerts from a widget
Create a monitor straight from any metric widget, without leaving the dashboard. Click the bell icon and set:
* **Monitor name** — a label for the alert.
* **Threshold** — the value that triggers it (GT, GTE, LT, LTE, or EQ).
* **Run types** — apply it to simulation runs, monitoring runs, or both.
This is a shortcut to the Monitors page with the widget's metric pre-filled, so you only set the threshold condition.